1. Functional space
Usually, we think of fMRI data as voxels in a 3D space of x, y, and z coordinates. Thinking of our data this way highlights the spatial relationship of each voxel; i.e., how near or far it is from another voxel of interest.
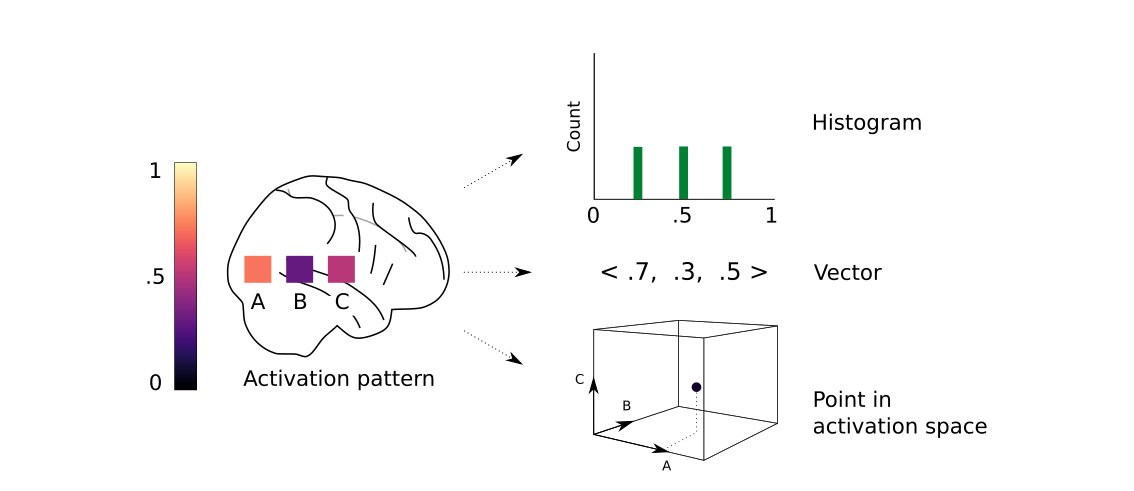
There are other, non-spatial ways that we can conceptualize our data, however. At each time point, we can look at the relative activation of each voxel and create multiple, unique representations of our data. For example, three representations of a given voxelwise activation pattern might be:
As a histogram showing the distribution of activity profiles
As a vector of relative activations for each voxel
As activity points in an N-dimensional activation space, where N is equal to the number of voxels
Each of these methods are illustrated in Fig. 1.1.

Fig. 1.1 Three different ways of conceptualizing a given voxelwise activity pattern: a histogram of activation levels, an activation vector, or a point in activation space. Figure adapted from Churchland [1998].
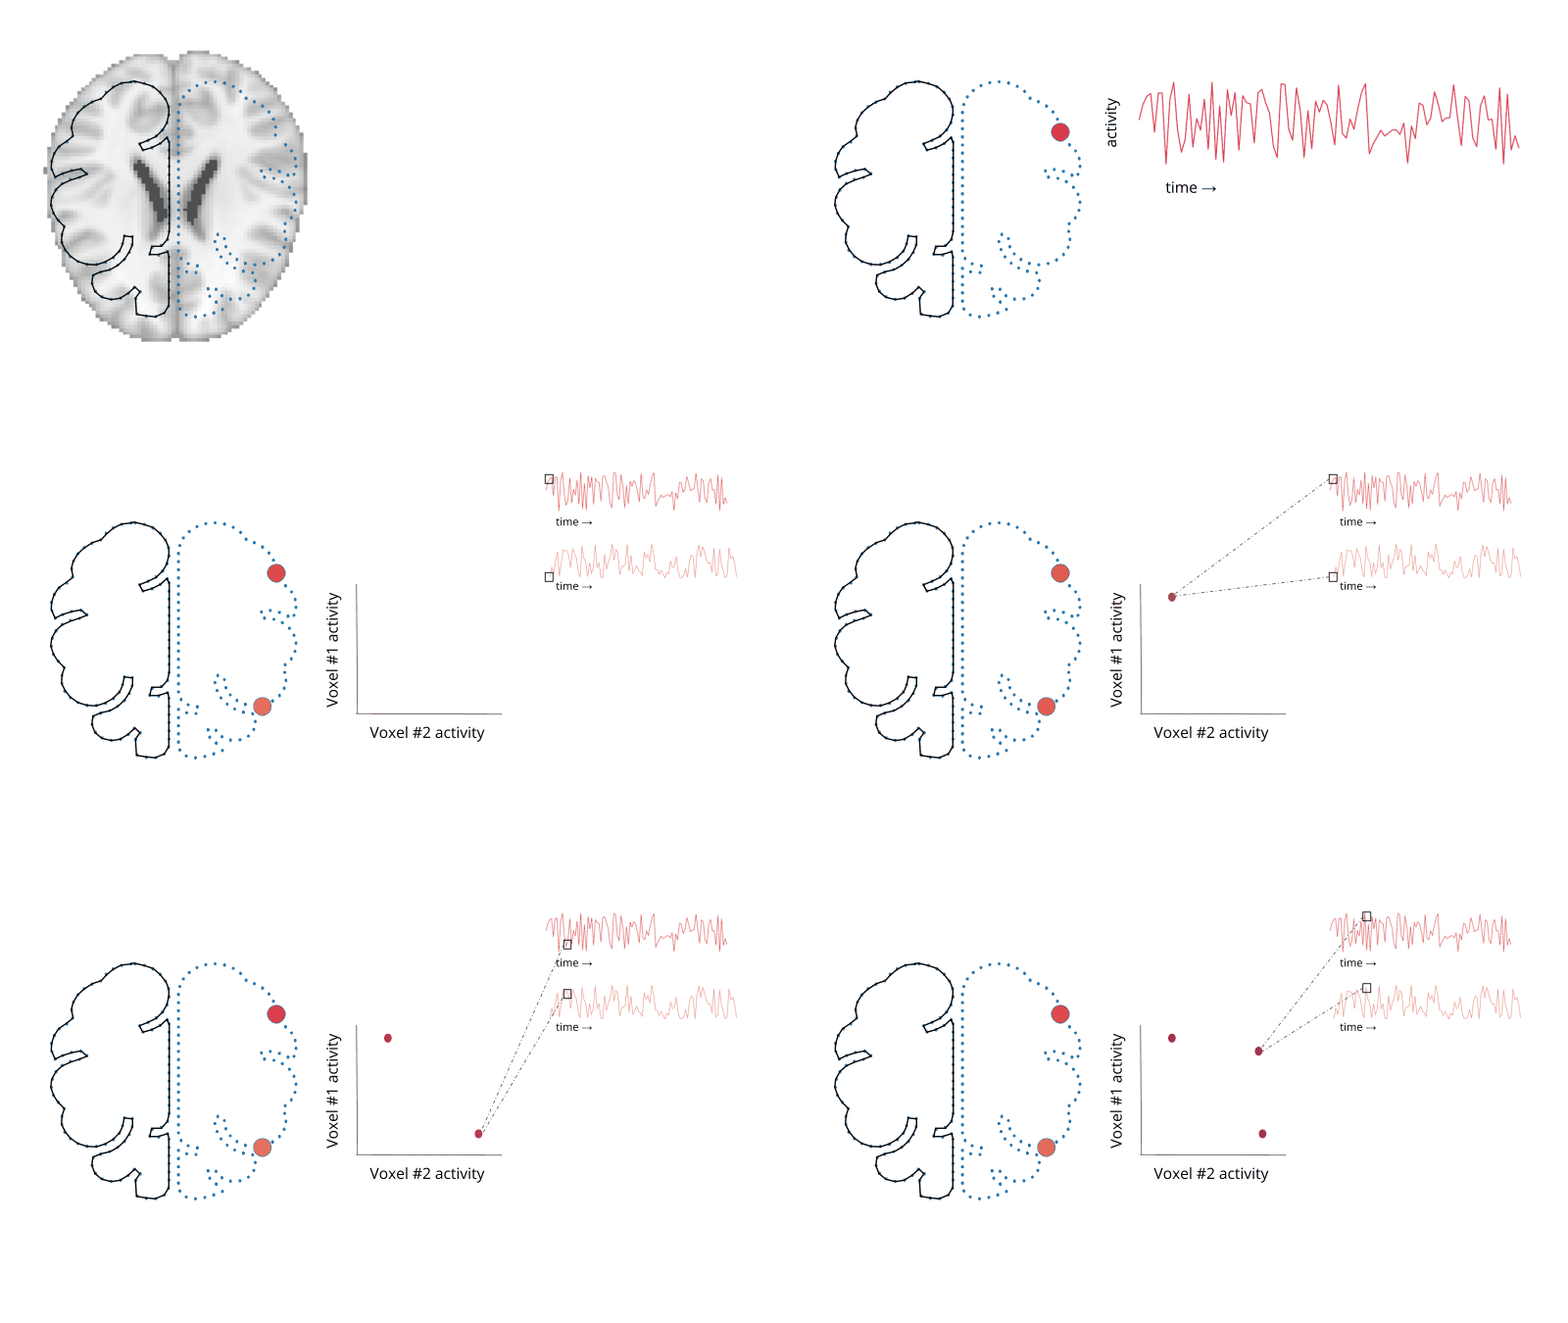
Importantly, there is no reason that we need to limit these non-spatial representation to only a single timepoint. That is, we can define a new two-dimensional space, where each dimension corresponds to one voxel’s activity. For each time point, we then include a single data point that indexes the relative activity of each voxel at that time point. This basic idea is illustrated in Fig. 1.2.

Fig. 1.2 Moving from anatomical space to a high-dimensional voxel space. Here, we only consider two voxels to aid in visualization.
Although each of these representations equivalently summarize the data, we focus on the N-dimensional activity space to highlight a more geometric intuition for these methods. Note that as we increase the number of voxels, we also increase the number of dimensions. Past a small number of voxels, it’s no longer possible to visualize the accompanying N-dimensional spaces!
